
In part 1 of this series, I discussed the Inventory tool that is a part of Azure Automation’s config management and how to on-board an AWS VM for management. In this article, I will cover Change Tracking. With Inventory, you get a report on the Windows files, registry and services, as well installed software for the machines being monitored. However, Change Tracking takes it a step further and provides a notification whenever there is a change to anything that’s being tracked on the machine. It also provides the capability to perform queries against the change logs. Let’s take a look and see how it works.
Since I previously enabled Inventory, there’s nothing that needs to be done to enable Change Tracking. If you go to your Automation account in the Azure Portal, look under the Configuration Management section and click on “Change Tracking“. On the main screen, there’s a graphical layout of changes made to Windows services, registry, files, Linux daemons and software being tracked on the AWS VM that was previously on-boarded. In this case, there was 1 software change and a large number of changes to Windows services.

Below the graph, there’s a tabular layout indicating the resource name, resource type, source machine and time of change.

You can click on one of the resources to see more details about how it was modified. If I select one of the Windows Update changes, more details are provided about exactly what changed. Below it shows that the service state changed from “Running” to “Stopped”.

Configure Change Tracking
Change Tracking is customizable by allowing you to configure which Registry keys, services or files are tracked. To configure Change Tracking, click on the “Edit Settings” button at the top of the main screen. This will bring you to the Workspace Configuration page for Change Tracking.

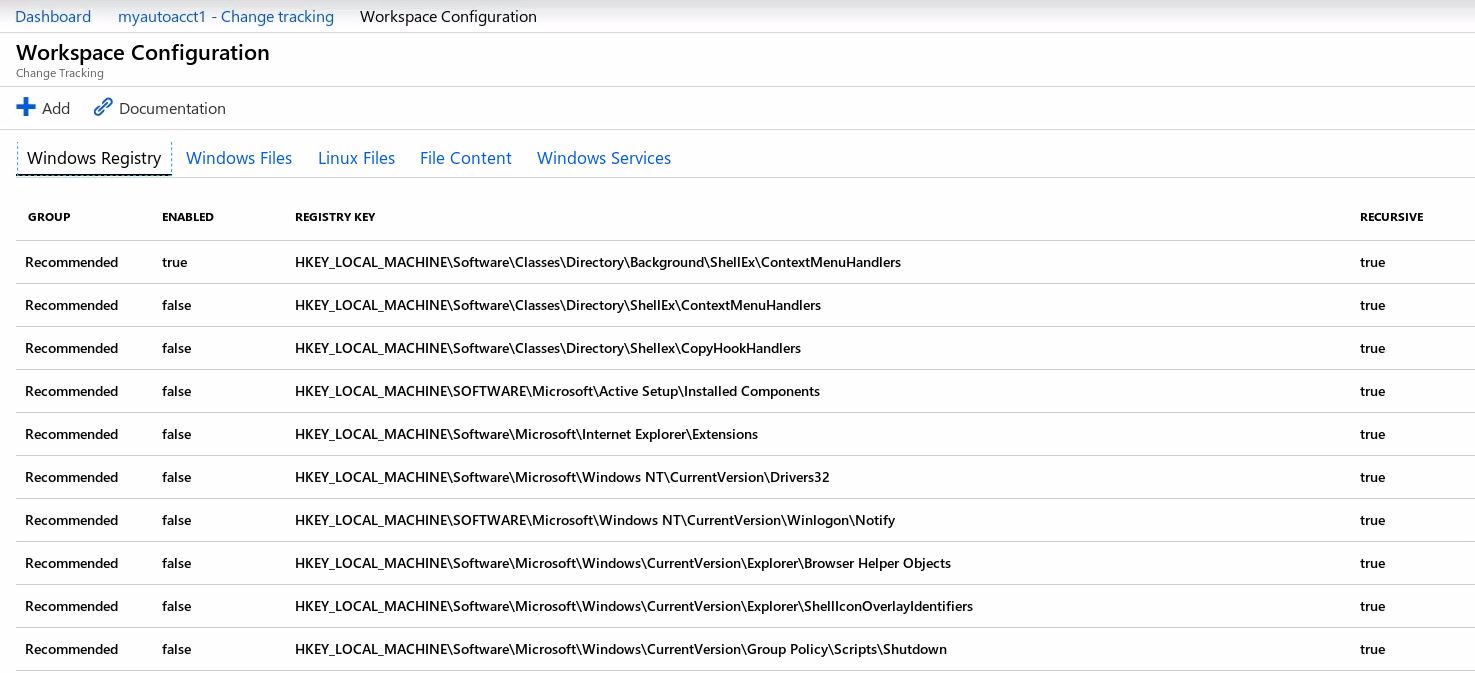
Here you will see sections for each type of resource that is able to be tracked. Under “Windows Registry” in the below screenshot, you will see a list of recommended keys to track. They’re disabled by default. To enable a key, just click on it and set enabled to “true” You can also add a registry key by clicking on the “Add” button.
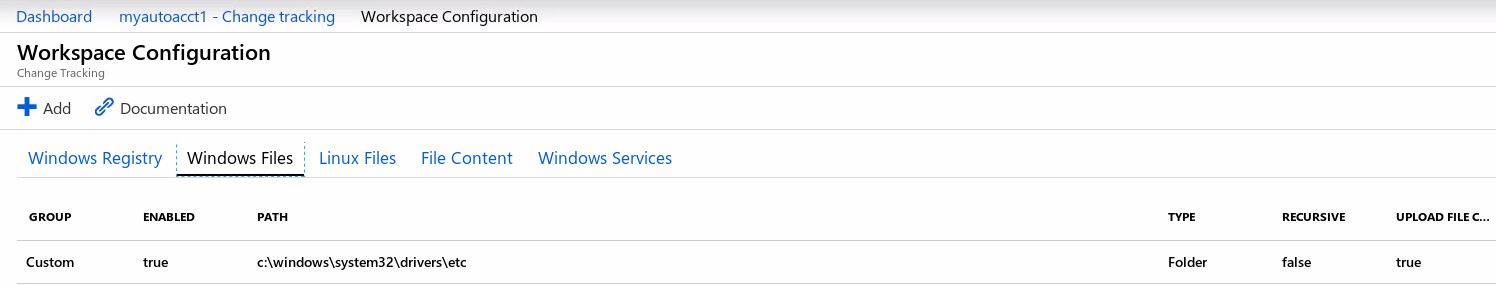
Under “Windows Files” you can view the files being tracked. These have to be added manually. For example, I have added the “c:\windows\system32\drivers\etc” folder path. If a change is made to the Hosts file or any other file in this location, it will be recorded in Change Tracking. Also, the process to enable tracking for Linux files is the same.
Another thing you can do under Workspace Configuration is enable the content of modified files to be saved in a Storage account. To get started, click on the “File Content” tab. Enabling this feature will generate a Share Access Signature (SAS) Uri that can be used to access the stored data. I won’t go into the details on how this works, but it’s very helpful if you would like to provide others access to the change data.

Lastly, let’s see what can be done under “Windows Services”. The tracking for Windows services is enabled by default, but you can adjust the frequency that changes to them are reported. The default setting is every 30 minutes, but you can adjust to anywhere between that and 10 seconds. Here, I set the collection frequency to 10 minutes.

Querying Change Tracking Logs
Now I am going to discuss my favorite feature in Change Tracking – Logs search and query. Click on “Log Analytics” to view the page to execute queries against the logged changes.

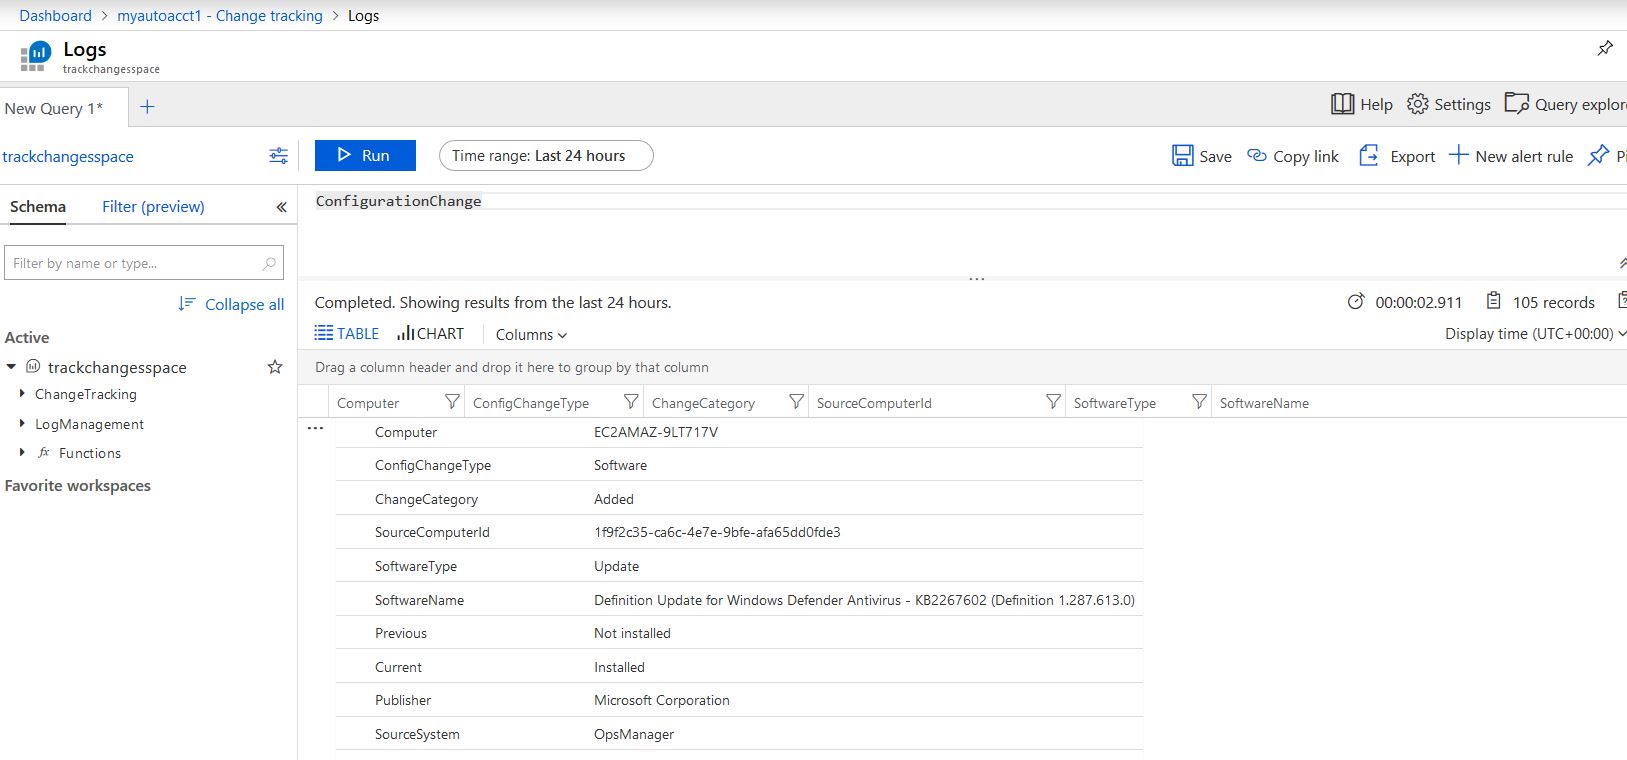
In the left side pane, there’s a schema that is built on the Workspace called “Trackchangesspace” that Log Analytics uses for Change tracking. In here there are two databases: ChangeTracking and LogManagement, which holds records of the data collected by the Tracking tool. with the Change Tracking database expanded to show its tables ConfigurationChange and ConfigurationData. In the main window is where queries are executed and the results are shown. When you first open the Log Analytics page, all the changes collected in the last 24 hours are displayed by default in a tabular view.

By clicking on the “>” symbol next to an item, you can get more details. For example, below are details about one of the software modifications. It shows the SoftwareName, Computer, ChangeCategory, Previous and Current states. In this case, an update for Windows Defender Antivirus was added.
What if you want to run a query of all Windows services that are stopped? In the top pane, you can write a KQL query that searches in the ConfigurationChange table for all services whose SvcState is equal to stopped in the following format:
Configuration | where SvcState == “Stopped”. I was pleasantly surprised to discover that the query editor has built-in tab completion and intellisense. This is very helpful for lousy typists like me, or you are used to IDE’s like VScode or Powershell ISE. Do note this: the query is case sensitive. If you type “Stopped” with a lower case “s”, the query will not yield any results. If you are a Powersheller, your experience is that comparison values are not case-sensitive.

Here’s another time saver for building queries: In the below figure, I went back to the results pane and expanded one of the Windows services to get the detailed information. By placing the cursor next to “SvcState”, two buttons will appear: a plus and minus. Clicking on the plus button will add the search logic for all Windows services where the SvcState is stopped. Then just click “Run” to get the results. Nice!

Change Alerting
Lastly, Change Tracking provides the ability to configure alert rules if you would like to receive notifications on certain changes. In the Logs window, click on “New alert rule” to set this up. In the screen blow, set the resource as the Workspace used by Change tracking, add the appropriate logic for the condition and define how to receive notifications under Action groups. You can have the alerts emailed or sent via text messages.

Supplemental resources
The following links are to articles that discuss topics that are related to material covered in this article:
1. https://docs.microsoft.com/en-us/azure/kusto/query/ – an overview of Kusto Query Language (KQL)
2. https://docs.microsoft.com/en-us/azure/automation/automation-change-tracking – an overview of Chang tracking
3. https://docs.microsoft.com/en-us/azure/automation/change-tracking-file-contents – how to view contents of tracked files
This concludes Part 2 of 3 on Configuration management using Azure automation. In summary, this article explained how to utilize Change tracking to monitor particular resources on an AWS virtual machine, how to perform queries against logged changes and setup alerts for those changes. The final article, part 3, will cover Azure State configuration (DSC).

One thought on “Azure Configuration Management of AWS VMs (Change Tracking) – Part 2”