
The Azure platform consists of a variety of resources that generate large volumes of activity and diagnostic log data. The source of this data can be subscription level events such as deallocating a virtual machine, deleting a resource group or creating a load balancer – essentially any create, update or delete operation on a resource. It can also include resource level activities such as a VM Windows event logs, VM performance data, web app response times – logs related to resource utilitization.
In this article, I will provide an overview of how Azure Monitor organizes all of this data, along with some examples of how Kusto Query Language (KQL) can be leveraged to parse this information.
AZURE MONITOR LOGS OVERVIEW
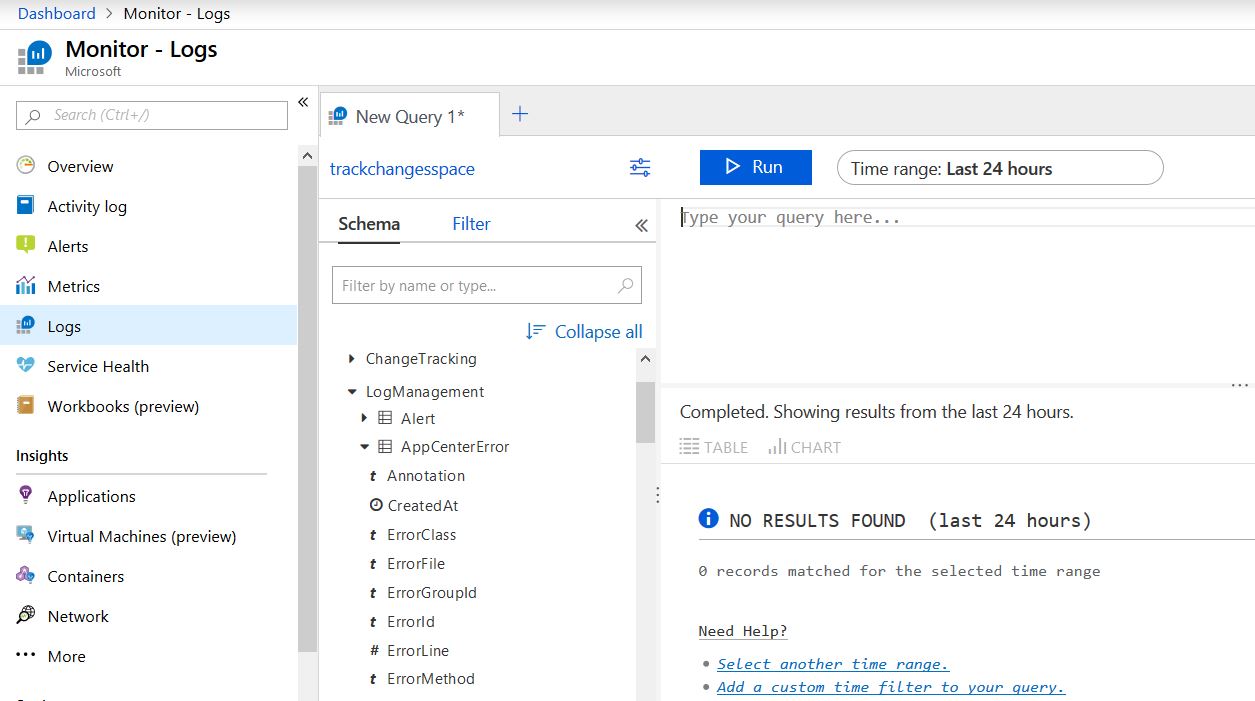
Azure Monitor Logs is responsible for collecting all log and telemetry data and organizing it in a structured format. The data is stored in a Log Analytics Workspace, which organizes it into categorical units. Within each unit or solution are tables that contain columns for various types of data. The data types can be string, numerical or date/time. The graphic below shows the Schema pane within Azure Monitor logs, which gives a hierarchical view of this structure. By default, it is scoped to a Workspace that I created which has three categories called ChangeTracking, LogManagement and SecurityCenterfree, as you can see here:

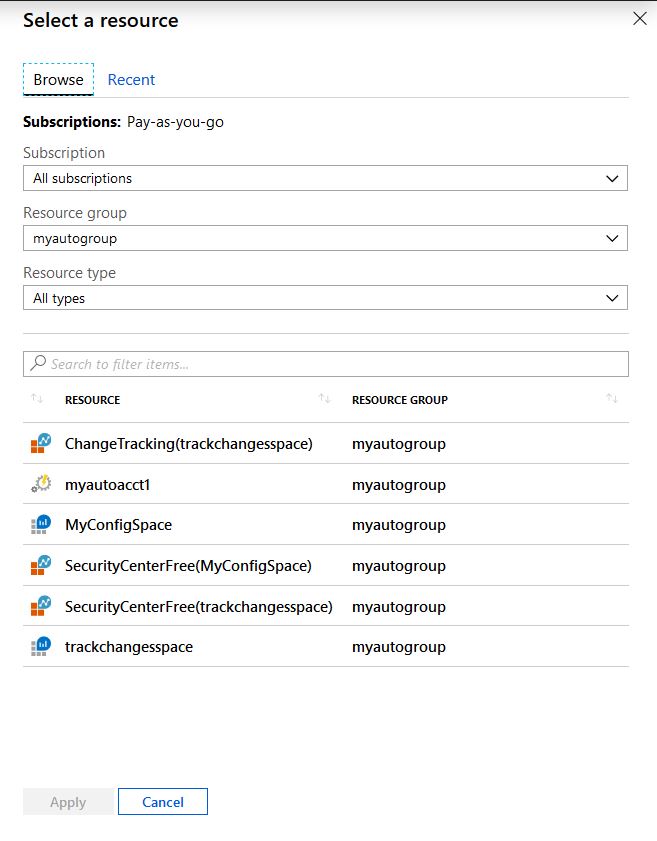
By the way, you have the ability to change the scope to either another Workspace, Resource group or subscription. To do this, click here 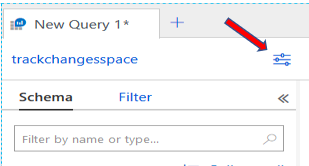 and the following window will appear:
But let’s go back to the originally scoped Workspace and see what it contains. By expanding the LogManagement unit, you can see its tables. Some of the tables are AuditLogs, AzureActivity, AppCenterError, etc.

As I mentioned, each table has columns for various types of data. If we look inside the AppCenterError table above, there are icons next to each column that represents the type of data it contains. For example, the  next to the Createdat column means it has date/time data; a
  next to the Errorline column is indicative of numerical data; and the
  indicates a column has textual data.
KUSTO QUERY LANGUAGE (KQL)
Now that we’ve gone over the Azure Monitor Logs data platform, let’s take a look some ways to analyze all of the data it holds using Kusto Query Language. All queries performed by KQL have at least one table as its search base. However, the scope of a query can expand across all tables, multiple tables or only one table – you have the right to choose. Also, when executing queries in the Query editor, the default time frame is 24 hours, which can be customized. Here are some examples.
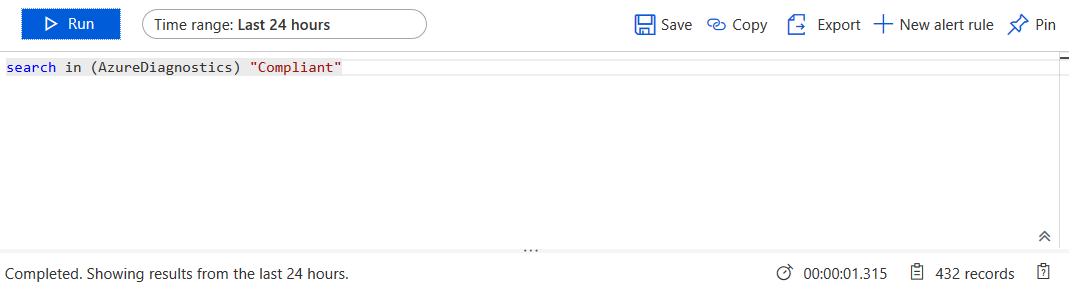
The following query searches for the keyword “compliant” in the AzureDiagnostics table. It retrieves all of the records in the AzureDiagnostics table and pipes it to the “search” operator.
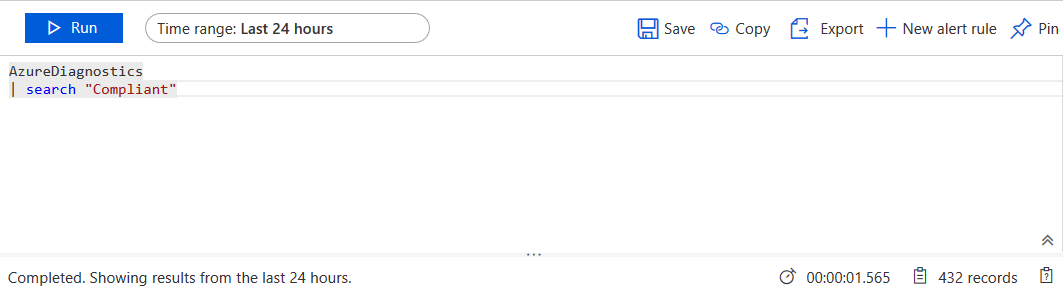
Here’s another way to perform the previous query. Instead of retrieving all records in the table and then filtering, the search operation is executed directly on the AzureDiagnostics table. Although, there are times when the former query is more suitable.
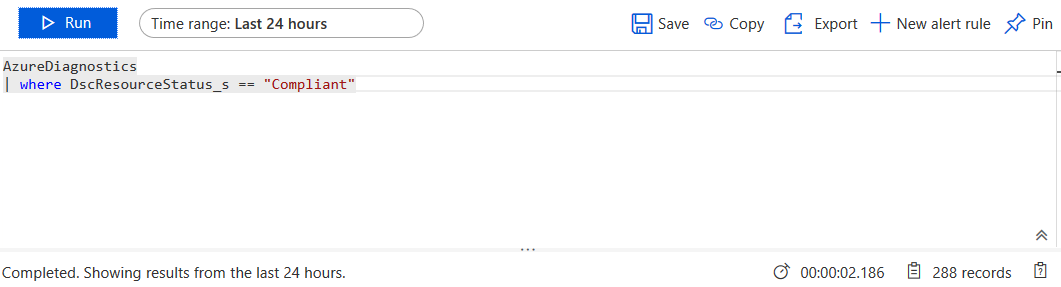
You can further narrow the scope of the previous query to a certain column in the AzureDiagnostics table. This command takes all data from the AzureDiagnostics table and filters out any records in the DSCResourceStatus_s column with the keyword Compliant.
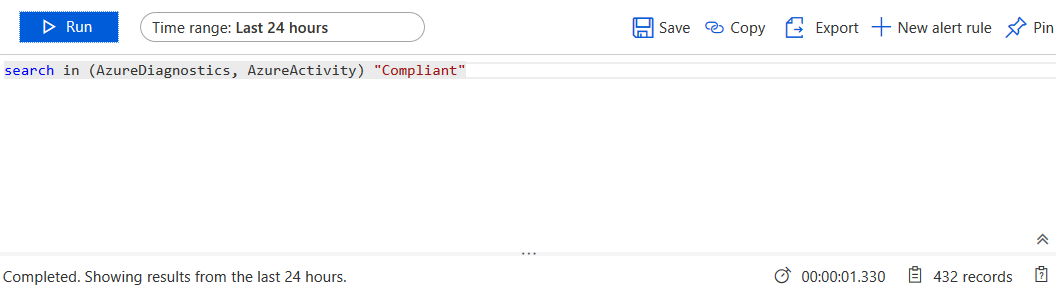
How about performing queries across multiple tables? You can perform a query across an array of tables with the following example:
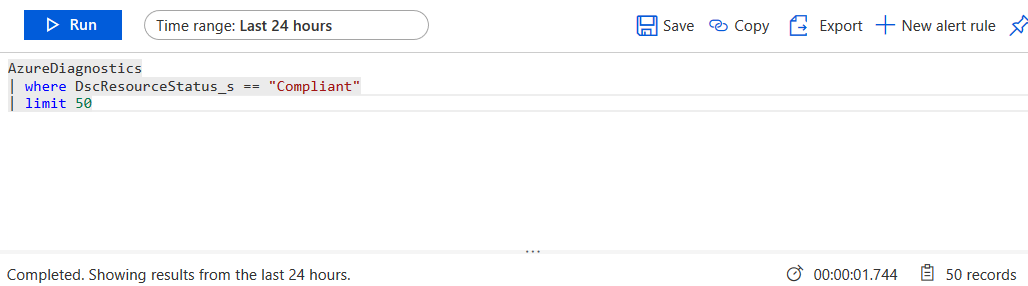
If you want to reduce the result size of data set, use the Limit operator. The Take operator can be used as well, as the two operators are synonymous. Also, they will retrieve a random subset of records.
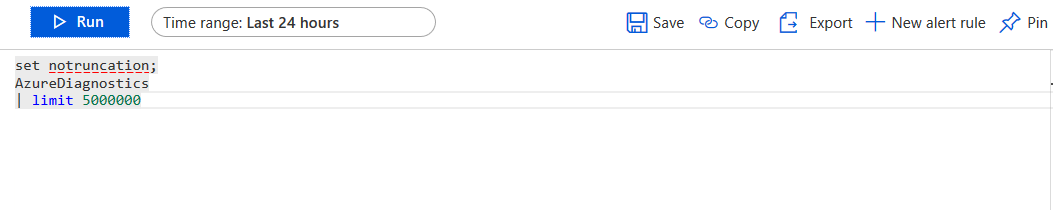
By default, the maximum number of records that can be produced by the Kusto Data engine is 500,000 or or no more than 64 MB in size. Therefore, if you specify a limit of say 550,000, the query will fail. If you find this to be unacceptable, you can summon the Dark Side of the Force and suppress the default query limit with the notruncation option and retrieve any number of records (not recommended, however):
In conclusion, Azure Monitor logs is a valuable tool for performing data gathering and analysis. The Cloud has elevated the importance of data and being able to parse it for insight into your environment. With Azure Monitor logs comes the ability to consume log data from a variety resources and perform Kusto queries across a multitude of data sets.
